
Understanding how efficiently an insurance company pays claims is critical when choosing a provider. While marketing may highlight affordability or features, actual claim settlement ratios are what truly matter ,they reflect the insurer's commitment to protecting clients when it counts.
Industry Benchmark Summary
| Segment | National Avg. Claim Ratio |
|---|---|
| Motor (Liability) | 8.63% |
| Health (Medical) | 65.96% |
| Life (Long-term) | 76.23% |
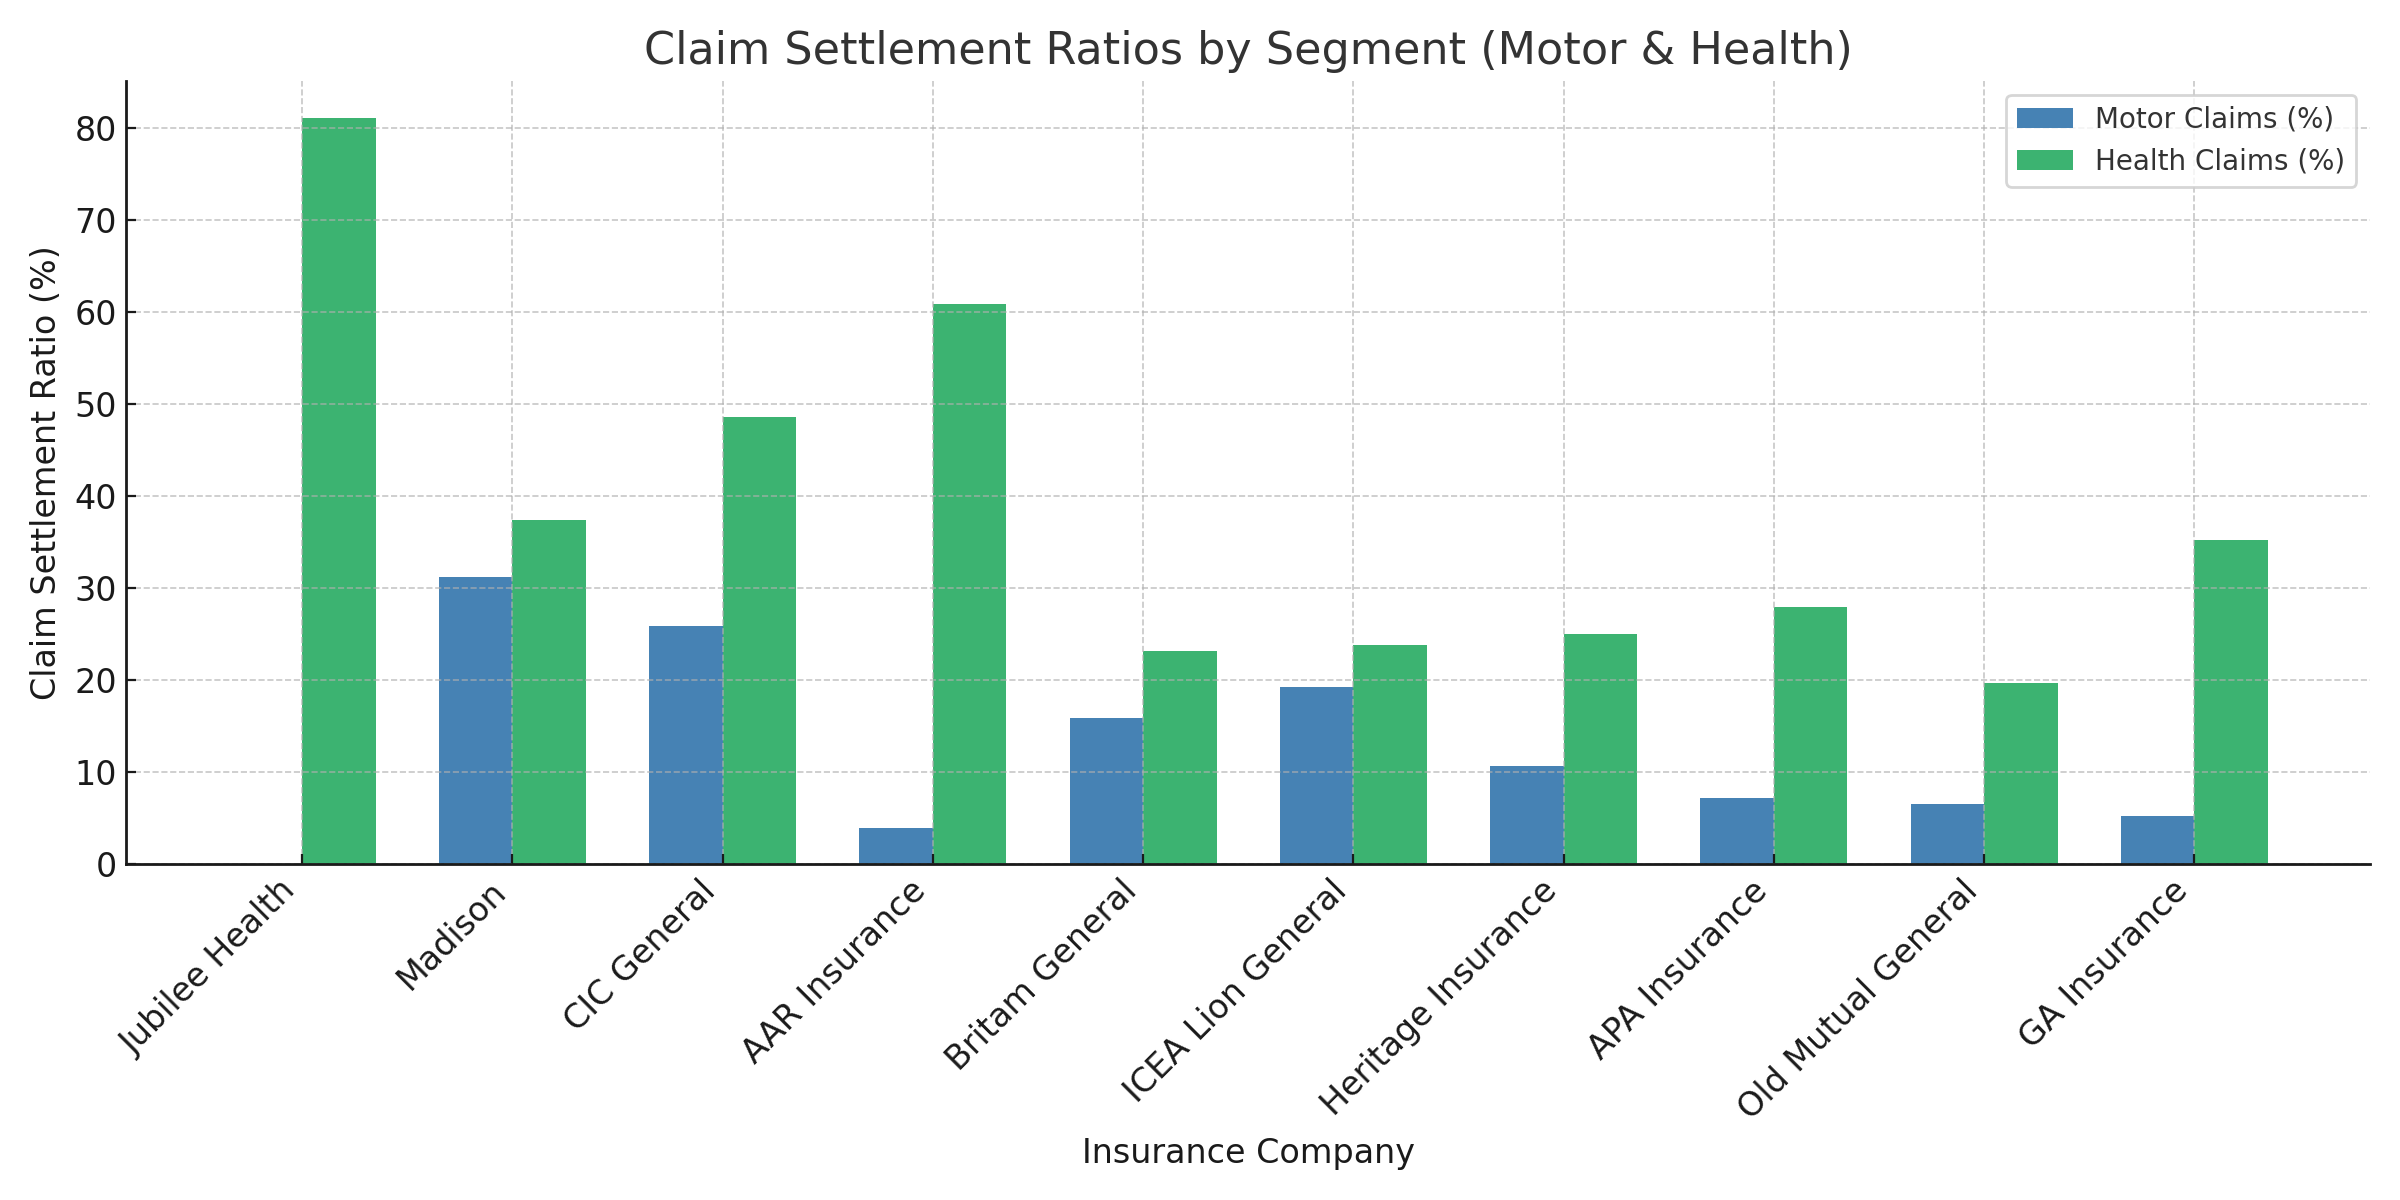
Segment-Based Claim Settlement Performance by Company 2024-2025
| Insurance Company | Motor Claims (%) | Health Claims (%) | Life Coverage |
|---|---|---|---|
| Jubilee Health | — | 81.1% | ✓ |
| Madison Insurance | 31.2% | 37.4% | ✓ |
| CIC General | 25.9% | 48.6% | ✓ |
| AAR Insurance | 4.0% | 60.9% | — |
| Britam General | 15.9% | 23.2% | ✓ |
| ICEA Lion General | 19.3% | 23.8% | ✓ |
| Heritage Insurance | 10.7% | 25.0% | — |
| APA Insurance | 7.2% | 28.0% | — |
| Old Mutual General | 6.6% | 19.7% | ✓ |
| GA Insurance | 5.3% | 35.3% | ✓ |
KEY:
- Bold = Top performers in that segment
- ✓ = Strong expected performer based on segment leadership
- _ = Not applicable / No presence in that line of business
Claim Settlement Trends (2013–2023)
- Motor Insurance: Declined from 75–80% (2013–2018) to 66% (2023–2024)
- Health Insurance: Held steady near 76%
- Life Insurance: Averaging 76.2% in 2024
Company-Level Claim Ratio Trends (2013–2018)
The table below compares historical claim payment performance from 2013 to 2018 for leading insurance companies in Kenya. These trends reflect how insurers have historically managed client payouts, especially in life and non-life segments.
| Insurer | 2013 | 2014 | 2015 | 2016 | 2017 | 2018 | Avg. 2013–18 |
|---|---|---|---|---|---|---|---|
| Jubilee | 71.9 | 66.7 | 70.7 | 75.5 | 66.4 | 77.7 | 71.5% |
| Britam | 59.1 | 66.3 | 67.7 | 72.6 | 69.6 | 70.9 | 67.7% |
| ICEA Lion | 50.3 | 66.5 | 77.2 | 62.0 | — | 125.5 | 73.7% |
| CIC | 89.5 | 98.0 | 97.7 | 83.3 | 64.7 | 73.2 | 84.4% |
| Madison | 124.3 | 100.9 | 90.9 | 92.6 | 71.3 | 82.7 | 93.8% |
Insights (2013–2018)
- Jubilee, Britam, and ICEA Lion maintained below-average but stable claim ratios, offering a balance between timely payouts and underwriting profitability.
- CIC and Madison consistently outperformed in claim payouts. However, their high claim ratios raise questions about long-term underwriting discipline and pricing sustainability.
2019–2023: Sector Payment Ratios & Key Behaviors
According to IRA data, average claim payment ratios declined to approximately 66–68% as of 2023. This trend signals a general tightening in claim adjudication across the sector.
Highlights:
- Jubilee Health, Madison, and CIC continue to outperform the average in non-life claim settlements.
- ICEA Lion and Heritage maintain claim ratios consistently below 50%, indicating prudent underwriting and stable profitability.
- Mid-tier insurers such as Britam, GA, and Old Mutual tend to operate close to the industry’s average, balancing competitiveness with risk control.
Key Takeaways for Policyholders
- High Payout Insurers: Companies like Madison and CIC offer high claim guarantees, although their elevated payout ratios may result in increased future premium rates.
- Balanced Performers: Jubilee, Britam, and ICEA Lion deliver consistent settlements aligned with market expectations and regulatory benchmarks.
- Efficient Underwriters: ICEA Lion and Heritage demonstrate disciplined underwriting by maintaining low yet reliable payout ratios.
- Decline in Sector Payout: Industry-wide claims payout ratios have decreased from mid-70s to mid-60s in recent years, signaling a stricter approach to claims vetting and settlement across the board.
These trends highlight the importance of evaluating both claim ratios and underwriting strength when choosing your insurance provider. Whether you prioritize quick claims, financial stability, or balanced service, these metrics provide a reliable guide.
Segment-Level Claim Trends: Motor vs. Health (2013–2023)
1. Market Share & Loss Ratios (2018)
According to 2018 IRA data:
- Motor insurance accounted for 49% of general insurance claims, with a loss ratio of 62.5%.
- Medical (Health) insurance represented 36% of claims, but carried a significantly higher loss ratio of 75.6%.
Implication: Although motor insurance sees the highest number of claims, health claims consume a larger portion of total payouts — nearly three-quarters of collected premiums.
2. Claim Payment Ratios: A Decade of Change
Motor Insurance- 2013–2018: Motor claim payment ratios averaged between 75–80%.
- By 2023: Ratios declined to approximately 66%, largely due to tighter adjudication and enhanced fraud control.
- 2018: Academic research showed health claim payout ratios consistently above 75%.
- Q1 2024: Average medical claim ratio remained around 76%, reflecting continued robust settlement practices, despite fraud pressure.
3. Key Drivers Behind Segment Trends
Motor Insurance:- Increased fraud,including fake accident reports, staged incidents, and duplicate policies.
- Stricter underwriting practices and advanced risk assessment tools have contributed to the decline in payout ratios.
- High fraud exposure: Estimated 20% of medical claims involve some level of fraud.
- Despite this, payouts remain strong due to regulatory requirements and growing consumer demand for healthcare support.
4. Segment Differential: What It Means
| Segment | Payment Ratio (2018) | Payment Ratio (2023) | Notable Trend |
|---|---|---|---|
| Motor | 75–80% | 66% | Downward trend; tighter underwriting |
| Health | 75.6% | 76% | Stable high payouts despite fraud |
Interpretation: Motor insurance has seen a payout decline of approximately 10–15 percentage points, signaling increased scrutiny and more rigorous investigations. In contrast, health insurance maintains resilient payout levels, reinforcing its reliability for Kenyan policyholders.
What Policyholders Should Know
- Motor insurance claims are increasingly denied or placed under investigative reviews due to fraud patterns. If speedy claims approval matters to you, consider companies known for quick motor claim resolution, such as Jubilee Health or CIC.
- Health insurance continues to provide consistent payouts in the mid-70% range. However, fraud-prevention protocols may cause delays in certain cases. Be sure to follow up and supply all necessary documentation promptly.
- Always confirm your insurer’s segment-specific claim settlement history—these are often published in quarterly IRA or insurer financial reports.
What’s Ahead
- Can motor claim ratios rebound to earlier levels (75%) through smarter fraud detection and AI-based claim vetting?
- Will health insurers maintain sub-80% payout performance even with rising fraud threats and regulatory compliance burdens?
- Stay updated through IRA Kenya’s 2025 segmental reports to watch for sector-wide shifts and insurer-specific claim performance.
Chart: Motor vs Health Claim Ratios
Insights & What It Means
- Jubilee Health is highly recommended for those seeking fast, reliable medical and outpatient claim processing. Their robust settlement framework in health insurance makes them a top-tier choice for families and employers alike.
- Madison General and CIC Insurance stand out for motor and third-party liability claims. Both companies consistently exceed industry benchmarks, offering dependable resolution timelines and higher approval rates.
- AAR Insurance is a strong performer in outpatient and general health cover but shows slightly less efficiency in processing liability-related claims. Ideal for policyholders prioritizing outpatient benefits.
- ICEA Lion and Heritage Insurance maintain disciplined underwriting practices with steady, modest claim ratios suitable for risk-conscious clients focused on long-term financial stability.
- APA Insurance, Old Mutual General, and GA Insurance may offer comprehensive coverage but often come with longer turnaround times during claims processing. Patience and clear documentation are key when dealing with these providers.
- Larger Client Base = Risk Spreading: Insurers like Jubilee with millions of clients can handle large claims without major ratio fluctuations.
- Higher Claim Volume: If a company grows fast without proper risk screening, it may face higher fraudulent or high-cost claims, reducing payout consistency.
- Operational Pressure: Rapid client growth without system upgrades can delay claim processing and lower perceived performance.
Based on the claim settlement ratios and efficiency data from the IRA, here is a breakdown of what this means for Kenyan insurance policyholders when choosing their provider:
Choosing an insurer isn't just about premiums,it's about how they show up when it matters most: at claim time. Use this data-backed insight to make informed insurance decisions that protect your health, assets, and peace of mind.
Recommendations
| Priority Segment | Recommended Insurer(s) |
|---|---|
| Fast Health Claims | Jubilee Health, AAR Insurance |
| Reliable Motor Cover | Madison, CIC General |
| Balanced All-Round | Britam, ICEA Lion, Old Mutual |
Looking Ahead
Stay tuned for IRA’s Q2 and Q3 2025 claim reports for any emerging changes. A drop or rise in claim ratios often signals shifts in company stability or customer experience.
Insights & Implications
High Payer Versus Profit Stability
Insurance companies such as Madison and CIC have consistently delivered higher claim payouts. While this is highly beneficial for policyholders seeking reliability and trust in the claims process, it can compress profit margins for insurers, potentially affecting pricing sustainability or future underwriting strategies.
Shift in Non-Life Claiming Behavior
The recent decline in non-life claim ratios to around 66–68% indicates a shift in how claims are evaluated and processed. This change reflects tighter regulatory controls and stricter underwriting standards. While this supports industry solvency and profitability, it could also affect policyholder satisfaction if claims are delayed or rejected more frequently.
Improved Life Insurance Settlements
Life insurance claim ratios have risen to approximately 76% a
Does the Number of Clients Affect Claim Settlement Ratios?
Yes. The number of policyholders an insurance company has can significantly impact its claim settlement ratio. While the ratio itself is based on the value of claims paid versus those reported, having many clients introduces several dynamics:
Comparison: Client Volume vs Claim Ratio
| Company | Clients | Claims Paid (KES) | Claims Reported (KES) | Claim Ratio (%) |
|---|---|---|---|---|
| BigCo Insure | 1,000,000 | 8B | 10B | 80% |
| SmallCo Insure | 20,000 | 200M | 250M | 80% |
| RiskyCo Insure | 25,000 | 180M | 200M | 90% |
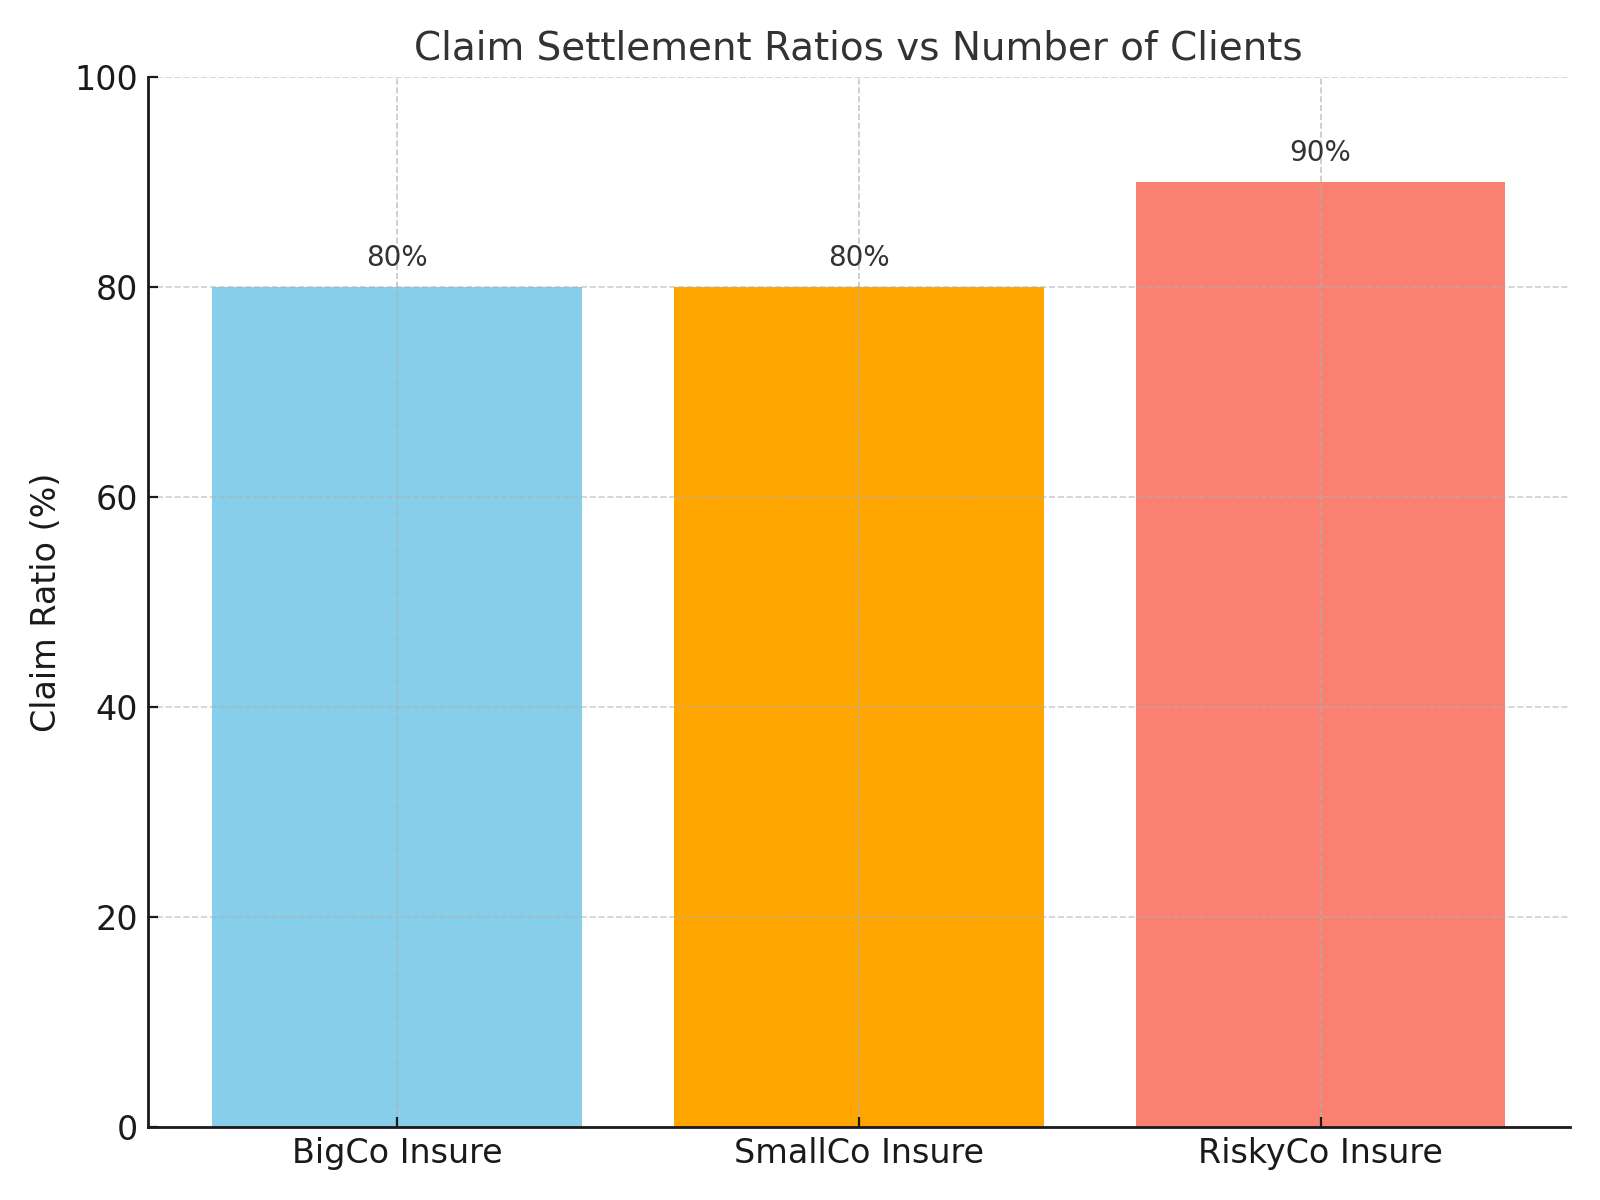
As shown, a high claim ratio doesn't always mean better performance, it could signal high-risk exposure. A stable, large client base can maintain healthier, more predictable claim payouts.
Comments (0)
No comments yet. Be the first to comment!
Leave a Comment